
Landmark SHE_SEES exhibition comes to Portsmouth
After its launch at last year’s London International Shipping Week, our SHE_SEES exhibition is opening at the Portsmouth Historic Dockyard.
This page is approximately a 1 minute read
This page was published on
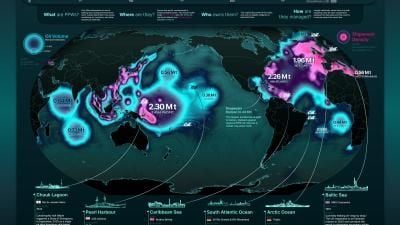
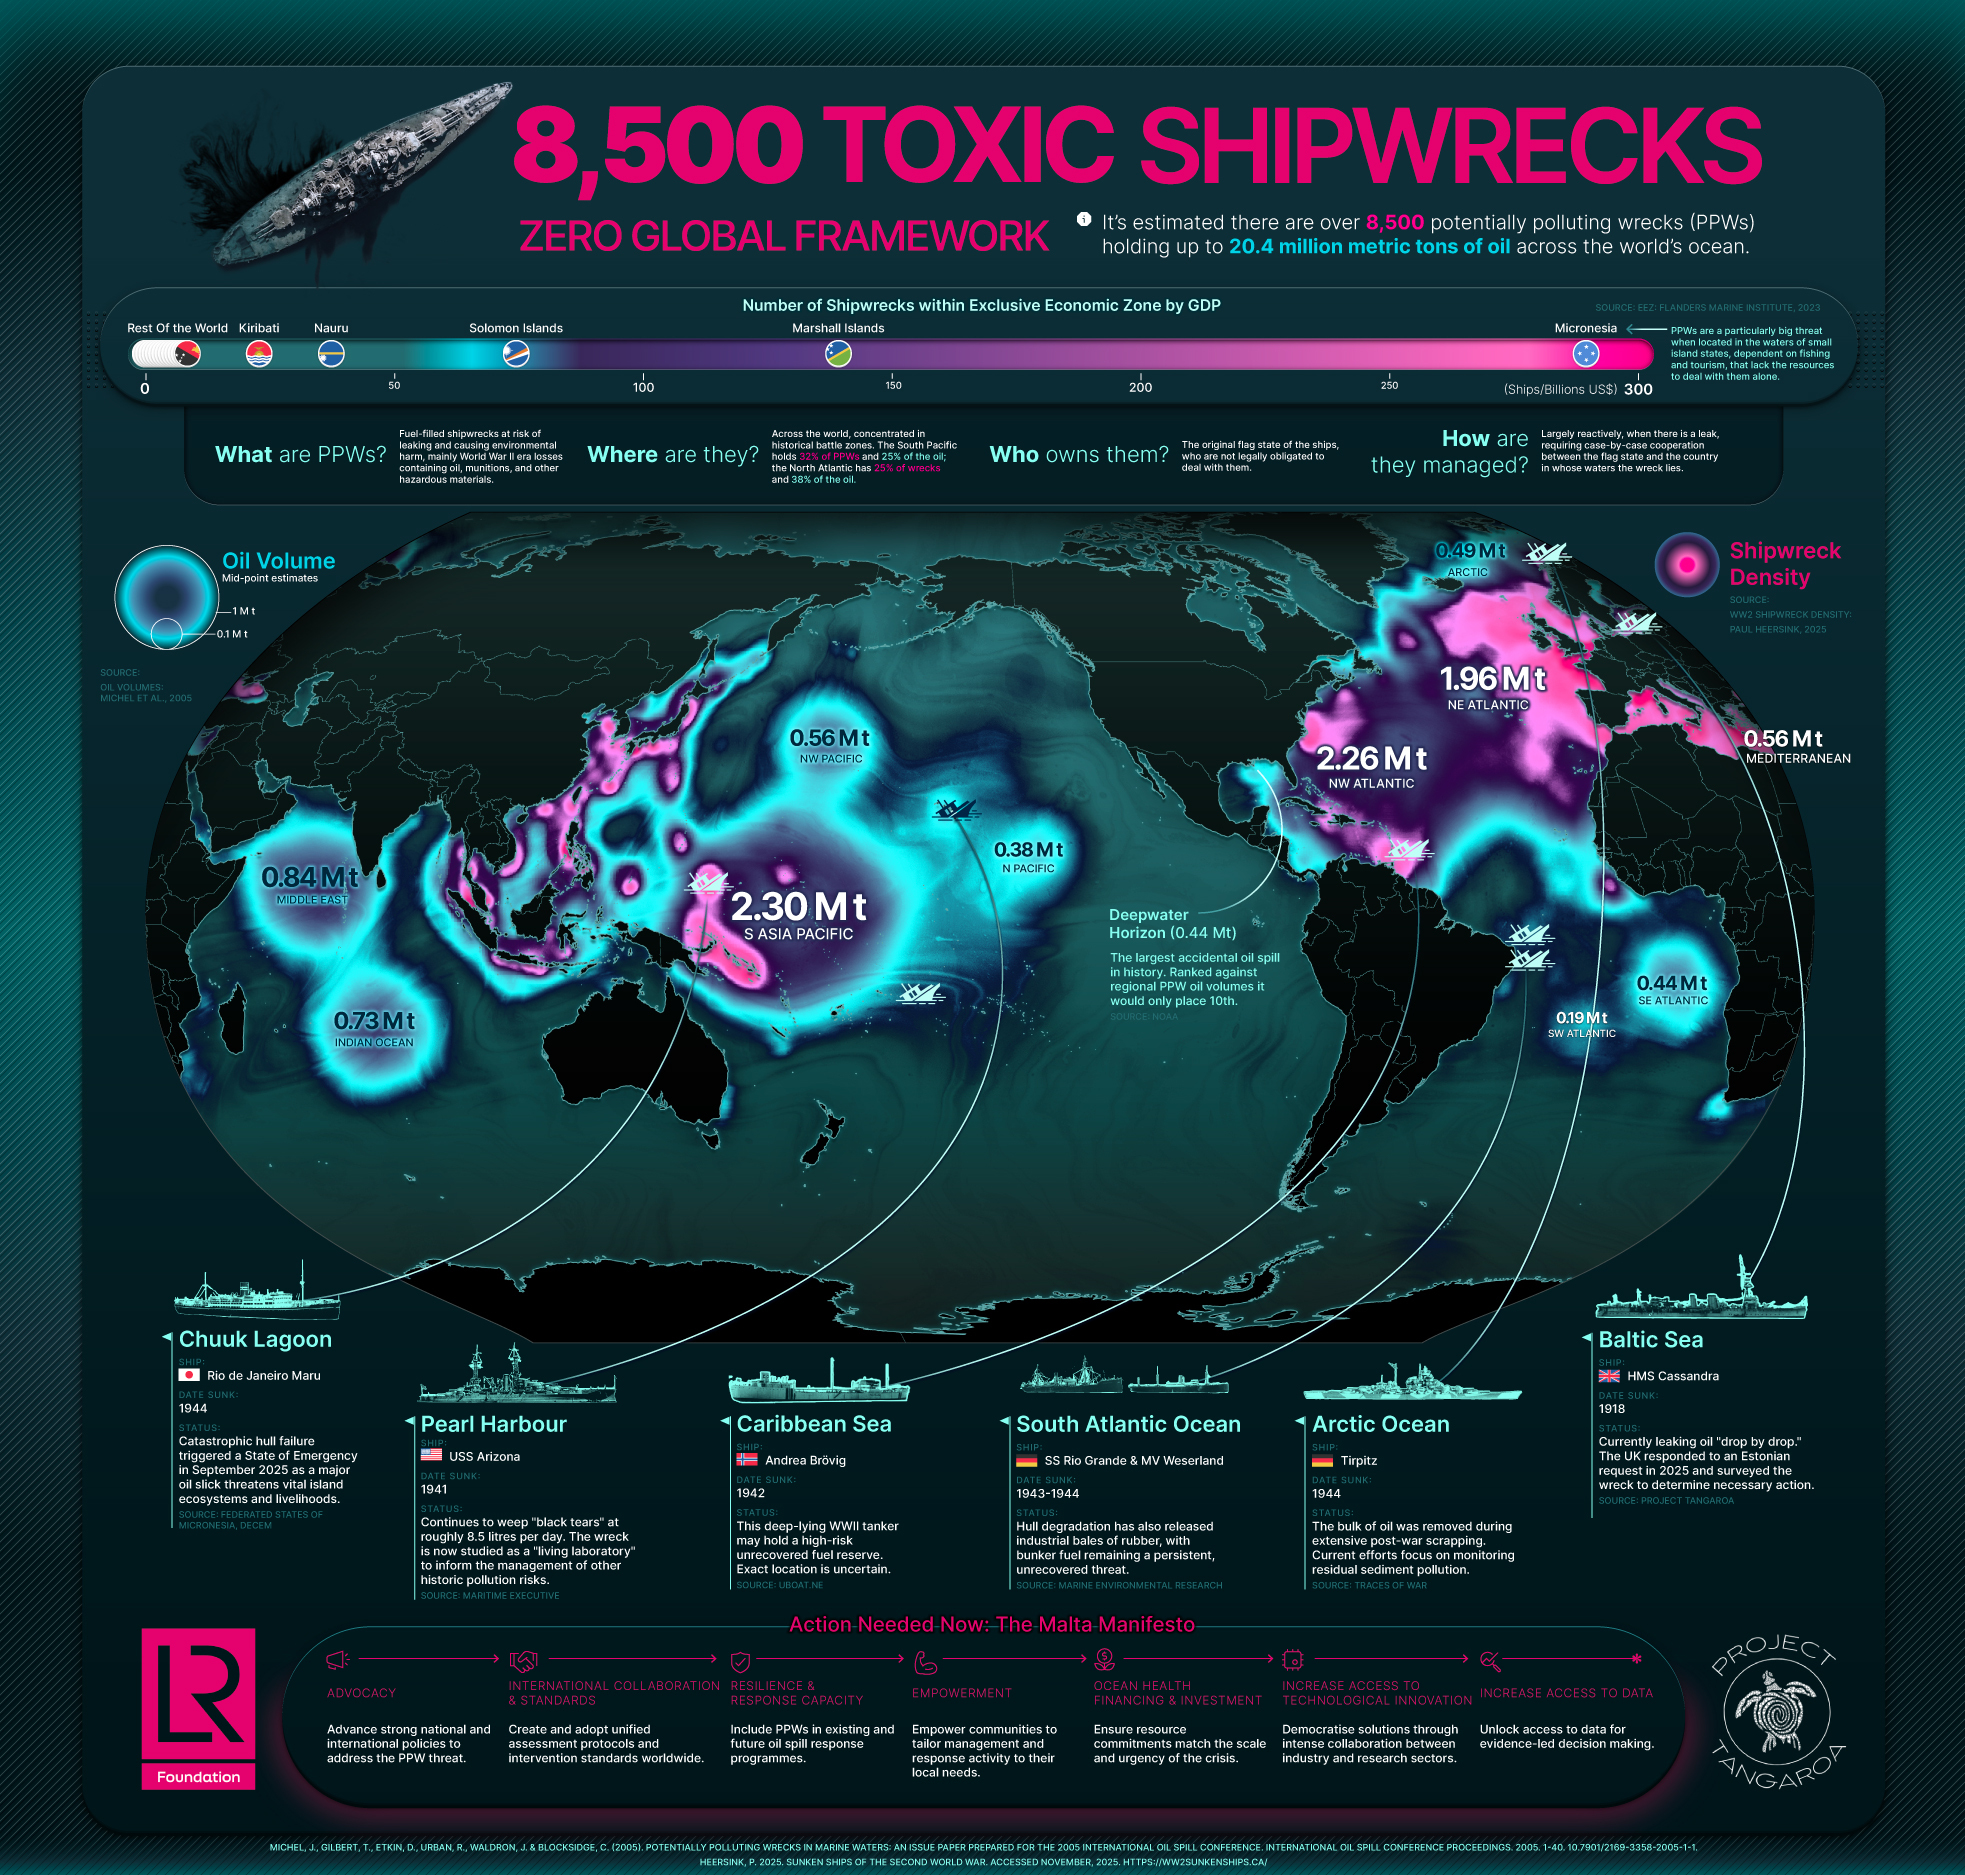
This graphic, produced in partnership with Visual Capitalist, maps the global distribution of potentially polluting shipwrecks (PPWs) left over from the conflicts of the 20th century, along with the oil volumes estimated to remain within them.
There are over 8,500 such wrecks littered across the bottom of world’s ocean, containing as much as 20.4 million metric tons of oil. Even a small amount of oil in the wrong place can be devastating to sensitive marine ecosystems, fishing communities and tourism-based economies.
Project Tangaroa – an international expert coalition coordinated by Lloyd’s Register Foundation, Waves Group and The Ocean Foundation – has published the Malta Manifesto as an urgent call to action to tackle this global safety and environmental threat.
This graphic is based on data from Paul Heersink’s Sunken Ships of the Second World War database and oil estimates from Michel et al (2005).
You are welcome to reuse this graphic for non-commercial purposes, with attribution. Example citation: Lloyd’s Register Foundation & Visual Capitalist. 2025. Mapping the threat of potentially polluting wrecks (available at https://www.lrfoundation.org.uk/publications/potentially-polluting-wrecks-protecting-people-and-planet).
After its launch at last year’s London International Shipping Week, our SHE_SEES exhibition is opening at the Portsmouth Historic Dockyard.
Rewriting Women into Maritime makes London International Shipping Week debut.
In this podcast, Lloyd's Register Foundation‘s Louise Sanger and Benjamin Ferrari discuss the catastrophic impact polluting wrecks are having on our oceans.

